v0.0.8VISSOFT @ ICSME 2025
Research version accepted at VISSOFT
Research build linked to the VISSOFT @ ICSME 2025 publication and the first XR metric visualization workflow.
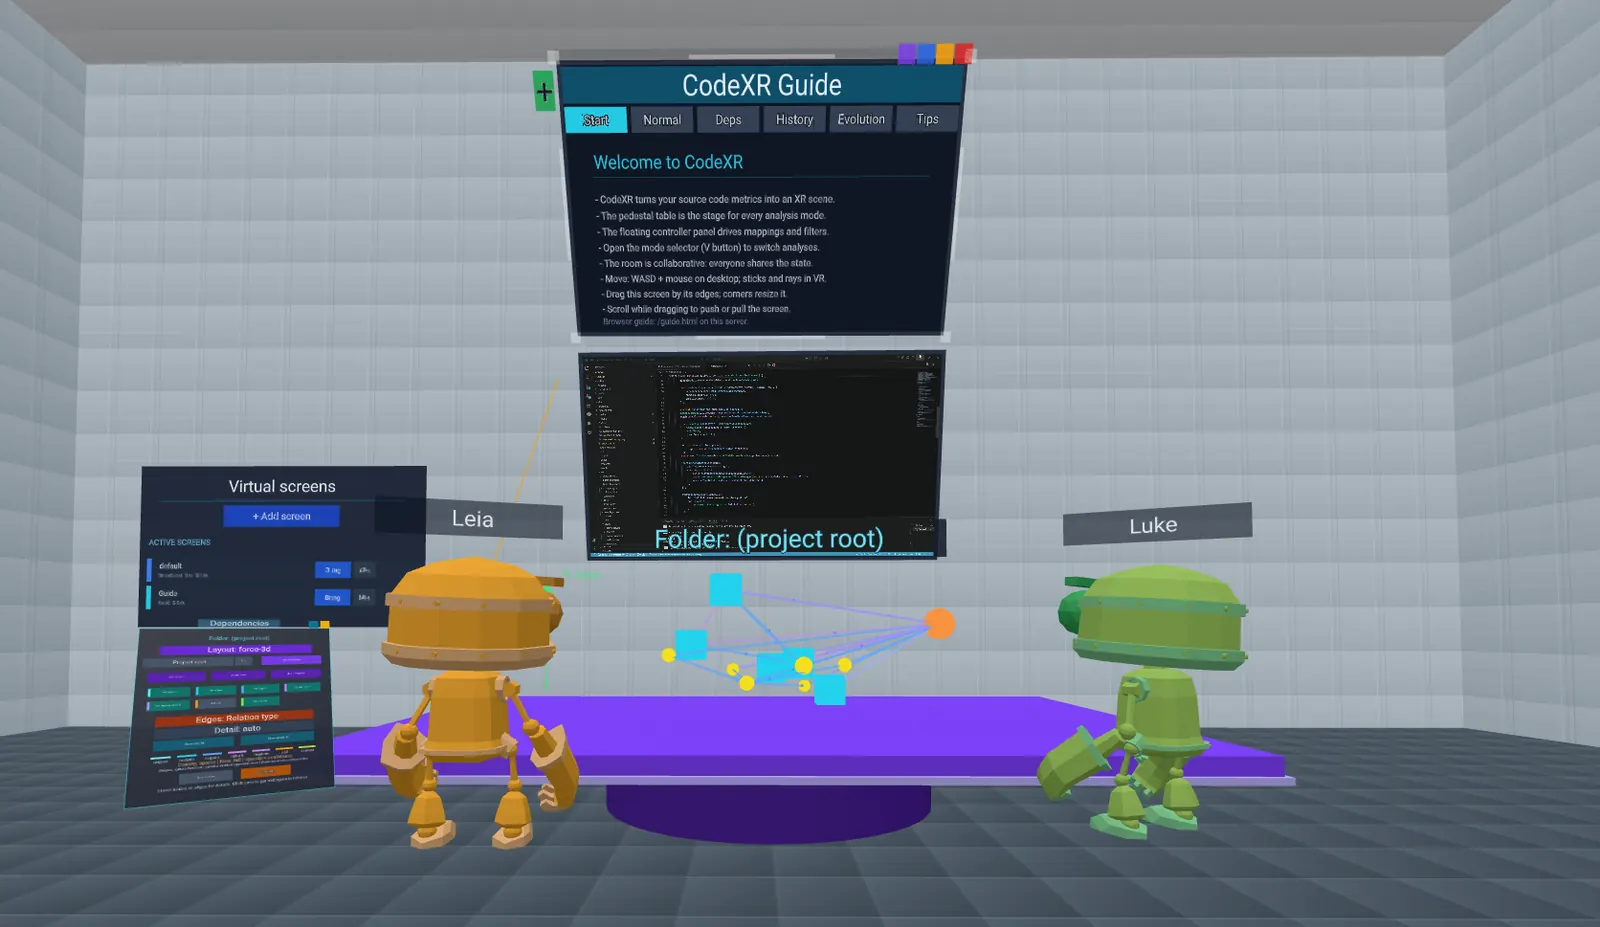
Code-XR is an open-source VS Code extension that turns a codebase into a 3D city you can walk through in your browser, and keeps it updating as you edit. No headset needed, though it works in VR. Version 1.2.0 puts four analyses on the same table: the code city, a navigable dependency graph, a side-by-side comparison of two Git revisions, and a playable movie of the whole project history, plus rooms you can share with someone outside your own network.
DOI 10.1109/VISSOFT67405.2025.00034Project narrative
Code-XR started as a way to make software metrics easier to understand than in a traditional static dashboard. The first goal was to connect live code analysis with an immersive XR scene, so files, directories, and complete projects could be explored spatially from Visual Studio Code, and so the scene would keep up with the code as it changed. Version 0.0.8 was the research version linked to VISSOFT @ ICSME 2025. In October 2025 I presented version 1.0.0 before the university committee, with basic file and directory analysis already working. The project did not stop there: on March 22, 2026 I released version 1.1.0, a substantial evolution focused on performance, collaboration, virtual screens, safer in-scene chart remapping, richer metrics, improved file/directory/project workflows, and a more robust Python-backed setup.
On July 30, 2026 I released version 1.2.0, "Threads, Timelines & Global Networks", which turned the extension into a shared XR workspace. The same pedestal now serves four analyses you switch between without losing the state of any of them: the classic code city, a navigable 3D dependency graph with three layouts, a dual table comparing two points of the Git history, and Project Evolution, which replays the whole repository as a film. Around them, collaboration gained persistent identities and bundled avatars, a session can be opened to someone outside your network through an outbound Cloudflare tunnel gated by a six-digit pairing code, and a six-tab user guide lives inside the room so the question "what am I looking at" never requires taking the headset off. The immersive behaviour was debugged end to end in emulated WebXR sessions with Meta’s Immersive Web Emulator, on desktop browsers and the emulator rather than physical headsets. The packaged extension also shrank from 39.2 MB to 6.1 MB.
Role & contributions
Sole author and end-to-end developer. Built the VS Code extension, Python analysis pipeline, JSON persistence layer, XR scene generation with A-Frame/BabiaXR, marketplace packaging, and documentation site. Version 1.1.0 focused on performance, shared rooms, virtual-screen controls, and safer metric remapping. Version 1.2.0 added the per-language dependency adapters, safe Git snapshot materialization that never runs checkout or fetch, the Cloudflare tunnel and six-digit pairing flow behind cross-network sessions, and the in-room user guide. Academic supervision by David Moreno Lumbreras (PhD, TFG supervisor).
Versions & milestones
Research build linked to the VISSOFT @ ICSME 2025 publication and the first XR metric visualization workflow.
University defense version with stable file and directory analysis inside the VS Code extension.
18x faster pipeline, shared rooms, virtual screens, safer remapping, richer metrics, and improved Python setup.
Dependency graph, historical comparison and Project Evolution join the classic analysis on one XR table, with collaboration 2.0, cross-network sessions and a VSIX down from 39.2 MB to 6.1 MB.
Tech stack
What's new in v1.2.0
v1.2.0July 30, 2026Threads, Timelines & Global Networks
Threads are the new dependency graph: the lines that tie a codebase together. Timelines are the two Git analyses, one that compares two points of the history and one that replays the whole thing. Global Networks are the sessions that can now be opened to someone who is not on your network at all.
Full tutorial (12:24)A new analysis that answers what depends on what, and what breaks if you touch it. Relations are read straight from the code in your working directory and rendered as a navigable 3D graph.
Pick two sources (the working copy, a branch, a tag or a commit) and both states land on one dual table with the same chart, the same mapping and the same scale, so a height difference is a real difference.
Where the comparison shows two photographs, Project Evolution plays the movie: one full-size chart walking the repository from its first revision to the current state of the branch.
The analysis Code-XR started with, one building per file sized and coloured by the metrics you choose, no longer has to be relaunched to be seen another way.
Persistent identities, authoritative host and guest roles, and a bundled animated avatar that works offline. Each participant gets their own colour and a name tag that always turns to face you.
The answer to "what am I looking at" no longer requires taking the headset off, and the 2D panel inside VS Code now carries the same analytics as the room.